
Key Sections of the Reporting Dashboard
1. Skills Section
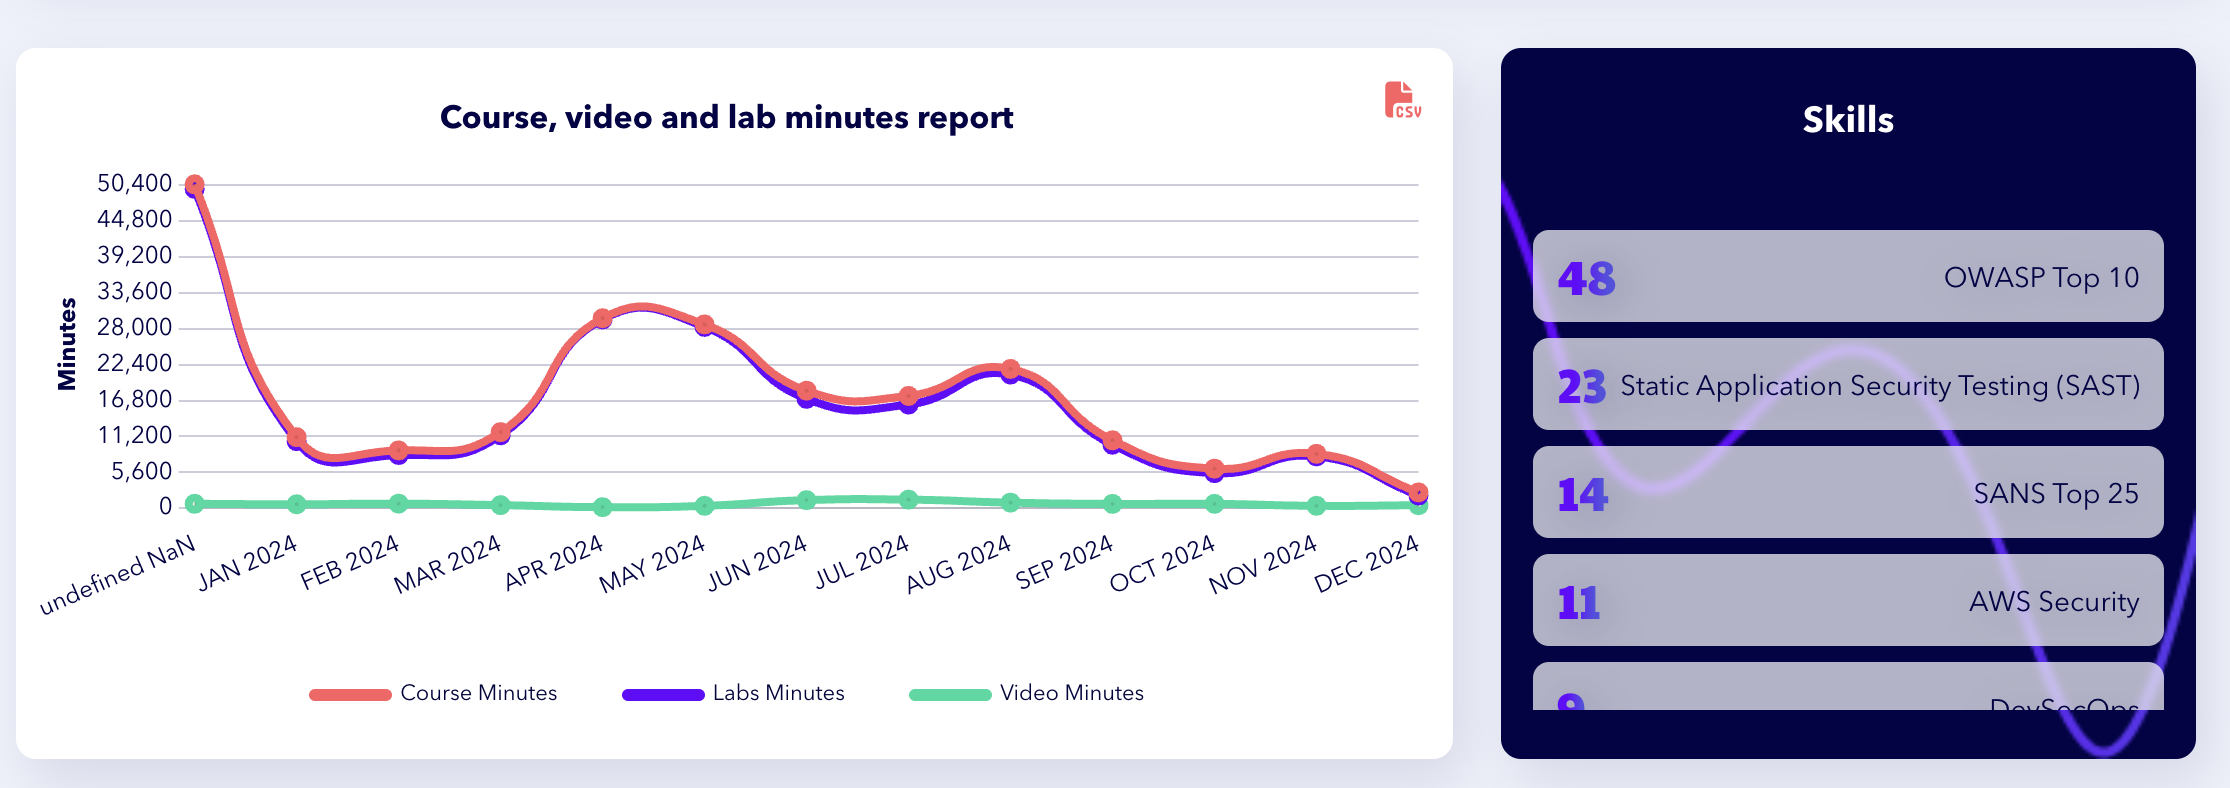 A report displaying trends in course, video, and lab minutes from January to December 2024, with a sidebar listing skills, including OWASP Top 10 and Static Application Security Testing.
-
This section highlights specific skills and areas where your teams have demonstrated improvement.
-
Examples of tracked skills include:
-
PCI-DSS compliance.
-
Source Composition Analysis.
-
Kubernetes Security.
-
-
Use this information to assess which areas require further focus or additional training modules.
2. User Leaderboard Section
-
Identifies outliers who consistently outperform.
-
Displays a ranked list of top learners within your organization.
-
Export Option: Download the leaderboard as a CSV file by clicking on the CSV button in the top-right corner.
3. Time Spent Section
-
Tracks the time teams spend on various learning paths.
-
Examples of tracked paths include:
-
Kubernetes Security.
-
Application Security.
-
-
Export Option: Download detailed time-spent data as a CSV file by clicking on the CSV button in the top-right corner.
4. Popular Courses Section
-
Displays the courses where teams have spent the most time across all learning paths.
-
Examples include:
-
Scala Security Misconfiguration.
-
Azure Functions Security.
-
-
Export Option: Download popular course data as a CSV file by clicking on the CSV button in the top-right corner.
5. Skills by Topic Section
-
Provides insights into specific skills built by teams across all learning paths.
-
Examples include:
-
PCI-DSS.
-
.NET Security.
-
Python Security.
-
-
Export Option: Download this data as a CSV file by clicking on the CSV button in the top-right corner.
Tips for Using the Reporting Dashboard
-
Focus Areas: Use the Skills Section and Skills by Topic Section to identify training gaps and prioritize future learning.
-
Celebrate High Performers: Recognize top users from the User Leaderboard to encourage continued engagement.
-
Analyze Engagement Trends: Leverage the Popular Courses and Time Spent sections to understand what content resonates most with your teams.
-
Export Regularly: Utilize the CSV export options for record-keeping, audit preparation, and detailed analysis.
For a practical guide to dashboard usage, explore Using the Organization Dashboard.